文章詳情頁
echarts實現3d柱狀圖的2種方式舉例
瀏覽:269日期:2022-06-01 13:59:39
目錄
- echarts實現3d柱狀圖的兩種方式
- 方法1: echarts.graphic.extendShape 自定義圖形
- 方式2: 象型柱圖(type: “pictorialBar”)
- 總結
echarts實現3d柱狀圖的兩種方式
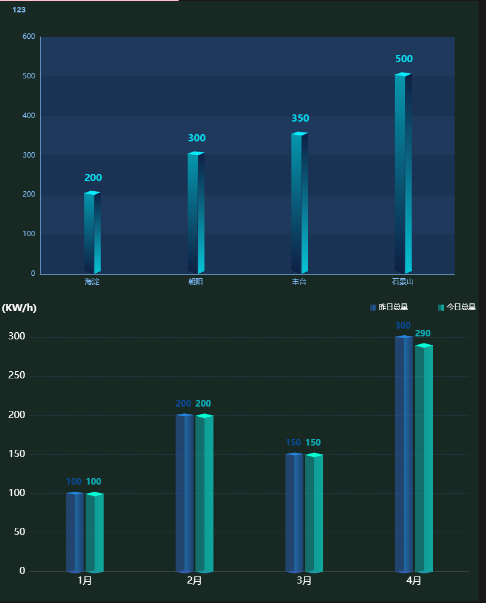
看了不少關于3d柱狀圖的案例,發現做3d柱狀圖 常用的兩種方式就是 自定義圖形和象型柱圖, 兩種實現方式效果如下:
方法1: echarts.graphic.extendShape 自定義圖形
echarts自定義圖形的詳細用法點這里, 官網點這里, 圖中第一個3d柱狀圖我參考的案例在這里, 看了很多 echarts這種3d案例, 自定義圖形做3d柱狀圖,貌似只能有個柱子(可能 能做雙柱,但是 我真的不會)
封裝成組件的完整代碼如下:
<template></template><script setup lang="ts">import { nextTick, watch } from "vue";import echarts from "@/assets/ts/echarts";import useResizeChart from "@/hooks/useResizeChart";function mergeConfig(defaultConfig: object, config: object) { return Object.assign(defaultConfig, config);}function initOption(): echarts.EChartsCoreOption { // 繪制左側面 const CubeLeft = echarts.graphic.extendShape({shape: { x: 0, y: 0,},buildPath: function (ctx, shape) { // 會canvas的應該都能看得懂,shape是從custom傳入的 const xAxisPoint = shape.xAxisPoint; const c0 = [shape.x + 3.5, shape.y]; const c1 = [shape.x - 11.5, shape.y - 3]; const c2 = [xAxisPoint[0] - 11.5, xAxisPoint[1] - 6.5]; const c3 = [xAxisPoint[0] + 3.5, xAxisPoint[1]]; ctx.moveTo(c0[0], c0[1])// @ts-ignore.lineTo(c1[0], c1[1]).lineTo(c2[0], c2[1]).lineTo(c3[0], c3[1]).closePath();}, }); // 繪制右側面 const CubeRight = echarts.graphic.extendShape({shape: { x: 0, y: 0,},buildPath: function (ctx, shape) { const xAxisPoint = shape.xAxisPoint; const c1 = [shape.x + 3, shape.y]; const c2 = [xAxisPoint[0] + 3, xAxisPoint[1]]; const c3 = [xAxisPoint[0] + 12, xAxisPoint[1] - 7]; const c4 = [shape.x + 12, shape.y - 7]; ctx.moveTo(c1[0], c1[1])// @ts-ignore.lineTo(c2[0], c2[1]).lineTo(c3[0], c3[1]).lineTo(c4[0], c4[1]).closePath();}, }); // 繪制頂面 const CubeTop = echarts.graphic.extendShape({shape: { x: 0, y: 0,},buildPath: function (ctx, shape) { const c1 = [shape.x + 3.5, shape.y]; const c2 = [shape.x + 12.5, shape.y - 7.5]; //右點 const c3 = [shape.x - 2.5, shape.y - 10]; const c4 = [shape.x - 11.5, shape.y - 3]; ctx.moveTo(c1[0], c1[1])// @ts-ignore.lineTo(c2[0], c2[1]).lineTo(c3[0], c3[1]).lineTo(c4[0], c4[1]).closePath();}, }); // 注冊三個面圖形 echarts.graphic.registerShape("CubeLeft", CubeLeft); echarts.graphic.registerShape("CubeRight", CubeRight); echarts.graphic.registerShape("CubeTop", CubeTop); const VALUE = props.value; const series = [{ type: "custom", renderItem: (params: any, api: any) => {let cubeLeftStyle = new echarts.graphic.LinearGradient(0, 0, 0, 1, [ {offset: 0,// @ts-ignorecolor: props.color[0], }, {offset: 1,color: "rgba(7, 20, 52,0.7)", },]);let cubeRightStyle = new echarts.graphic.LinearGradient(0, 0, 0, 1, [ {offset: 0,color: "rgba(7, 20, 52,1)", }, {offset: 1,// @ts-ignorecolor: props.color[0], },]);let cubeTopStyle = new echarts.graphic.LinearGradient(0, 0, 0, 1, [ {offset: 0,// @ts-ignorecolor: props.color[1] || props.color[0], },]);const location = api.coord([api.value(0), api.value(1)]);return { type: "group", children: [{ type: "CubeLeft", shape: {api,xValue: api.value(0),yValue: api.value(1),x: location[0],y: location[1],xAxisPoint: api.coord([api.value(0), 0]), }, style: {fill: cubeLeftStyle, },},{ type: "CubeRight", shape: {api,xValue: api.value(0),yValue: api.value(1),x: location[0],y: location[1],xAxisPoint: api.coord([api.value(0), 0]), }, style: {fill: cubeRightStyle, },},{ type: "CubeTop", shape: {api,xValue: api.value(0),yValue: api.value(1),x: location[0],y: location[1],xAxisPoint: api.coord([api.value(0), 0]), }, style: {fill: cubeTopStyle, },}, ],}; }, data: VALUE,},{ type: "bar", label: {show: true,position: "top",fontSize: 14,color: props.color[0],offset: [2, -10], }, itemStyle: {color: "transparent", }, tooltip: {}, data: VALUE,}, ]; const title = mergeConfig({ text: "", textStyle: {color: props.color[0],fontWeight: "800",fontSize: 12, }, left: "18px", top: "1%",},props.title, ); const XAxisLine = mergeConfig({ show: false, lineStyle: {type: "solid",width: 1,color: "#2c3954", },},props.XAxisLine, ); const YAxisLine = mergeConfig({ show: false, lineStyle: {show: true,lineStyle: { type: "solid", width: 1,}, },},props.YAxisLine, ); const legend = mergeConfig({ show: true, left: "center", top: "95%", icon: "circle", textStyle: {color: "#fff", },},props.legend, ); const grid = mergeConfig({ left: "5%", right: "5%", top: "12%", bottom: "0%", containLabel: true,},props.grid, ); const XSplitLine = mergeConfig({ show: false, lineStyle: {type: "dashed",width: 1, },},props.XSplitLine, ); // 縱坐標分割線配置 const YSplitLine = mergeConfig({ // 是否顯示 // show: false, show: true, // 樣式 lineStyle: {color: "#13263e",type: "solid",width: 1, },},props.YSplitLine, ); const XAxisTick = mergeConfig({ show: false, length: 5, inside: true, alignWithLabel: true, lineStyle: {type: "solid",width: 1, },},props.XAxisTick, ); const YAxisTick = mergeConfig({ show: true, length: 5, inside: true, alignWithLabel: true, lineStyle: {color: "#13263e",type: "solid",width: 1, },},props.YAxisTick, ); let option: echarts.EChartsCoreOption = {title,tooltip: { show: false, // 指示器提示的坐標軸 trigger: "axis", // 陰影提示器 axisPointer: {type: "shadow",shadowStyle: { shadowColor: "#2e3e51", // 設置陰影的顏色}, }, formatter: function (params: any) {const item = params[1];return item.name + " : " + item.value; }, // 提示框背景顏色 backgroundColor: "#122843", // 提示框邊框顏色 borderColor: "#42D1F1", // 提示框文本樣式 textStyle: {color: "#fff", },},legend: legend,grid: grid,xAxis: { type: "category", // boundaryGap: false, data: props.xAxisData, axisLine: XAxisLine, splitLine: XSplitLine, axisTick: XAxisTick, axisLabel: {//x軸文字的配置show: true,color: "#fff",fontSize: 12,rotate: 30, },},yAxis: { type: "value", name: props.yUnit, nameTextStyle: {color: "#fff",fontSize: 16, }, axisLine: YAxisLine, splitLine: YSplitLine, axisTick: YAxisTick, axisLabel: {//y軸文字的配置color: "#fff",fontSize: 12, },},series, }; option = Object.assign(option, props.config); return option;}const props = defineProps({ pid: {type: String,required: true, }, title: {type: Object,default: {}, }, xAxisData: {type: Array,required: true, }, legend: {type: Object,default: {}, }, grid: {type: Object,default: {}, }, XAxisLine: {type: Object,default: {}, }, YAxisLine: {type: Object,default: {}, }, yUnit: {type: String,default: "", }, XSplitLine: {type: Object,default: {}, }, YSplitLine: {type: Object,default: {}, }, XAxisTick: {type: Object,default: {}, }, YAxisTick: {type: Object,default: {}, }, config: {type: Object as () => echarts.EChartsCoreOption,default: {}, }, value: {type: Array,required: true, }, // 柱子的顏色 color: {type: Array,default: ["rgba(29, 230, 235,1)", "rgba(7, 235, 251,1)"], },});let option = initOption();let container: HTMLElement | null = null;let myChart: echarts.ECharts | null = null;const renderChart = (notMerge: boolean = false) => { if (!myChart) myChart = echarts.init(container as HTMLElement); myChart.setOption(option, {notMerge, });};nextTick(() => { container = document.querySelector("#" + props.pid) as HTMLElement; renderChart(); useResizeChart(container, myChart as echarts.ECharts);});watch( () => props, (newVal, oldVal) => {let notMerge = true;option = initOption();renderChart(notMerge); }, {deep: true, },);function exportImg() { const src = (myChart as echarts.ECharts).getDataURL({pixelRatio: 2,backgroundColor: "#08172A", }); const a = document.createElement("a"); a.href = src; a.download = (option.title as { text: string }).text || "chart-img"; a.click();}defineExpose({ exportImg,});</script><style lang="scss" scoped></style>方式2: 象型柱圖(type: “pictorialBar”)
echarts象型柱圖的官網配置項點這里, 參考的案例在這里, 象型柱圖可以單柱可以雙柱
封裝成組件的完整代碼如下:
<template></template><script setup lang="ts">import { nextTick, watch } from "vue";import echarts from "@/assets/ts/echarts";import { LegendComponent } from "echarts/components";echarts.use([LegendComponent]);// 合并配置方法function mergeConfig(defaultConfig: object, config: object) { return Object.assign(defaultConfig, config);}function initOption(): echarts.EChartsCoreOption { // 此時 使用組件只需要要將 zzx1的數據和 wgx1 的數據傳遞到子組件 // 第一個柱子的值 const zzx1 = props.series[0].data; // 實際值 // 第二個柱子的值 const wgx1 = props.series[1].data; // 變量: 改變每個柱子的大小, 后期可將其設置為動態的? const barWidth = 30; const series = [ // (0)第一個柱子 中間的正方形 { type: "pictorialBar", // 象型柱狀 symbol: "diamond", symbolSize: [barWidth, 5], // 調整大小 // symbolOffset: [-13, -3], // 圖形相對于原本位置的偏移 symbolOffset: ["-55%", -3], // 圖形相對于原本位置的偏移 symbolPosition: "end", z: 12, color: "#2584e0", data: zzx1, }, // (1)第二個柱子中間的正方形 { type: "pictorialBar", symbol: "diamond", symbolSize: [barWidth, 8], // symbolOffset: [13, -3], symbolOffset: ["55%", -3], symbolPosition: "end", z: 12, color: "#07fdd3", data: wgx1, }, // (2)第一個柱子 底部的正方形 { type: "pictorialBar", symbol: "diamond", symbolSize: [barWidth, 5], // symbolOffset: [-13, 3], symbolOffset: ["-55%", 3], z: 12, color: "#355ba8", data: zzx1, }, // (3)第二個柱子 底部的正方形 { name: "", type: "pictorialBar", symbol: "diamond", symbolSize: [barWidth, 5], // symbolOffset: [13, 3], symbolOffset: ["55%", 3], color: "#2095a3", z: 12, data: wgx1, }, // (4)一個柱子, 下方有顏色填充的的柱子 { name: props.nameOne, type: "bar", barWidth: barWidth, barGap: "10%", // zlevel: 2, stack: "1", itemStyle: {opacity: 0.7,color: new echarts.graphic.LinearGradient(0, 0, 1, 0, [ { offset: 0.5, color: "rgba(44, 97, 188,0.7)", // color: "#2c61bc", }, { offset: 0.5, color: "#2584e0", }, { offset: 1, color: "#214a87", },]),// barBorderRadius: 0,borderRadius: 0, }, // 是否在每個柱子顯示 相應的值 label: {show: true,position: ["0", "-25"],color: "#005dd9",fontSize: 14,fontWeight:"bold" }, data: zzx1, }, // (5)第二個柱子, 下方有顏色填充的的柱子 { name: props.nameTow, type: "bar", stack: "2", barWidth: barWidth, itemStyle: {opacity: 0.7,color: new echarts.graphic.LinearGradient(0, 0, 1, 0, [ { offset: 0.5, color: "rgba(15, 182, 182,0.7)", }, { offset: 0.5, color: "#0ccec7", }, { offset: 1, color: "#0bddd0", },]),// barBorderRadius: 0,borderRadius: 0, }, // 是否在每個柱子顯示 相應的值 label: {show: true,position: ["0", "-25"],color: "#06e6f6",fontSize: 14,fontWeight:"bold" }, data: wgx1, }, ]; // title 配置 const title = mergeConfig( { // 是否顯示 show: true, // title 文本 text: "", top: 0, left: "left", // 文字樣式 textStyle: {color: "#fff",fontSize: 16, }, }, props.title ); // 橫坐標軸線配置 const XAxisLine = mergeConfig( { // 是否顯示 show: true, // show: false, // 樣式 lineStyle: {// color: "rgba(46, 60, 87)",type: "solid",width: 1, }, }, props.XAxisLine ); // 縱坐標軸線配置 const YAxisLine = mergeConfig( { // 是否顯示 // show: true, show: false, // 樣式 lineStyle: {// 是否顯示show: true,// 樣式lineStyle: { color: "#fff", type: "solid", width: 1,}, }, }, props.YAxisLine ); // 橫坐標分割線配置 const XSplitLine = mergeConfig( { // 是否顯示 show: false, // 樣式 lineStyle: {color: "#fff",type: "dotted",width: 1, }, }, props.XSplitLine ); // 縱坐標分割線配置 const YSplitLine = mergeConfig( { // 是否顯示 show: true, // 樣式 lineStyle: {color: "rgba(46, 59, 86)",type: "dashed",// type: "solid",width: 1, }, }, props.YSplitLine ); // 橫坐標刻度配置 const XAxisTick = mergeConfig( { // 是否顯示 show: false, // 刻度長度 length: 5, // 是否朝內 inside: true, // 刻度是否居中 alignWithLabel: true, // 樣式 lineStyle: {color: "#fff",type: "solid",width: 1, }, }, props.XAxisTick ); // 縱坐標刻度配置 const YAxisTick = mergeConfig( { // 是否顯示 show: false, // 刻度長度 length: 5, // 是否朝內 inside: true, // 刻度是否居中 alignWithLabel: true, color: "#fff", // 樣式 lineStyle: {color: "#fff",type: "solid",width: 1, }, }, props.YAxisTick ); // 圖例標記配置 const legend = mergeConfig( { show: true, right: "0", top: "0", icon: "rect", itemHeight: 10, itemWidth: 10, textStyle: {color: "#fff", }, // 取消默認點擊事件 selectedMode: false, // 距離 itemGap: 50, }, props.legend ); // 指示器: const tooltip = { show: false, trigger: "axis", axisPointer: { type: "shadow", }, formatter: function (e: any) { // console.log(e); var str =e[4].axisValue +"<br>" +"<span style="display:inline-block;margin-right:5px;border-radius:10px;width:10px;height:10px;background-color:" +e[4].color.colorStops[0].color +";"></span>" +"" +e[4].seriesName +" : " +e[4].value +"<br>" +"<span style="display:inline-block;margin-right:5px;border-radius:10px;width:10px;height:10px;background-color:" +e[5].color.colorStops[0].color +";"></span>" +"" +e[5].seriesName +" : " +e[5].value; return str; }, // 提示框背景顏色 backgroundColor: "#122843", // 提示框邊框顏色 borderColor: "#42D1F1", // 提示框文本樣式 textStyle: { color: "#fff", }, }; // 匯總配置 let option: echarts.EChartsCoreOption = { title, tooltip, legend, grid: { top: "12%", left: "2%", right: "2%", bottom: "5%", // height: "85%", containLabel: true, }, xAxis: { type: "category", boundaryGap: true, data: props.xAxisData, axisLine: XAxisLine, splitLine: XSplitLine, axisTick: XAxisTick, axisLabel: {// textStyle: {color: "#fff",fontSize:16// }, }, }, yAxis: { type: "value", // 單位 name: props.yUnit, axisLine: YAxisLine, splitLine: YSplitLine, axisTick: YAxisTick, axisLabel: {// textStyle: {color: "#fff",fontSize:16// }, }, min: 0, // max: props.max, }, series, }; // 合并配置生成最終配置 option = Object.assign(option, props.config); return option;}// propsconst props = defineProps({ // 父容器ID pid: { type: String, required: true, }, title: { type: Object, default: {}, }, // 數據 series: { // type: Array as () => Array<BarSeriesOption>, type: Array as () => { data: number[] }[], required: true, }, // 橫坐標 xAxisData: { type: Array, required: true, }, // 圖例標記 legend: { type: Object, default: {}, }, // 橫坐標軸線 XAxisLine: { type: Object, default: {}, }, // 縱坐標軸線 YAxisLine: { type: Object, default: {}, }, // y軸單位 yUnit: { type: String, default: "", }, // 橫坐標分割線 XSplitLine: { type: Object, default: {}, }, // 縱坐標分割線 YSplitLine: { type: Object, default: {}, }, // 橫坐標刻度 XAxisTick: { type: Object, default: {}, }, // 縱坐標刻度 YAxisTick: { type: Object, default: {}, }, // 總配置,將與默認配置與用戶傳入的配置合并 config: { type: Object as () => echarts.EChartsCoreOption, default: {}, }, // 最值 // max: { // type: Number, // // requird: true, // default: 5000, // }, nameOne: { type: String, default: "昨日總量", }, nameTow: { type: String, default: "今日總量", },});// optionlet option = initOption();// chart 容器let container: HTMLElement | null = null;// chart 實例let myChart: echarts.ECharts | null = null;// 渲染方法const renderChart = () => { if (!myChart) myChart = echarts.init(container as HTMLElement); myChart.setOption(option);};// DOM加載后渲染 chartnextTick(() => { // 獲取容器 container = document.querySelector("#" + props.pid) as HTMLElement; // 渲染 chart renderChart(); // 自適應 chart // useResizeChart(container, myChart as echarts.ECharts);});// 監聽 props 變化watch( () => props, () => { // 更新 option option = initOption(); // 重新渲染chart renderChart(); }, { deep: true, });// 導出為圖片function exportImg() { // 生成 base64 圖片 const src = (myChart as echarts.ECharts).getDataURL({ pixelRatio: 2, backgroundColor: "#08172A", }); // 下載 const a = document.createElement("a"); a.href = src; a.download = (option.title as { text: string }).text || "chart-img"; a.click();}// 暴露出 chart 圖片導出方法,父組件可以通過實例調用defineExpose({ exportImg,});</script><style lang="scss" scoped></style>總結
到此這篇關于echarts實現3d柱狀圖的2種方式舉例的文章就介紹到這了,更多相關echarts實現3d柱狀圖內容請搜索以前的文章或繼續瀏覽下面的相關文章希望大家以后多多支持!
標簽:
JavaScript
相關文章:
排行榜

 網公網安備
網公網安備