python matplotlib imshow熱圖坐標(biāo)替換/映射實例
今天遇到了這樣一個問題,使用matplotlib繪制熱圖數(shù)組中橫縱坐標(biāo)自然是圖片的像素排列順序,
但是這樣帶來的問題就是畫出來的x,y軸中坐標(biāo)點的數(shù)據(jù)任然是x,y在數(shù)組中的下標(biāo),
實際中我們可能期望坐標(biāo)點是其他的一個范圍,如圖:
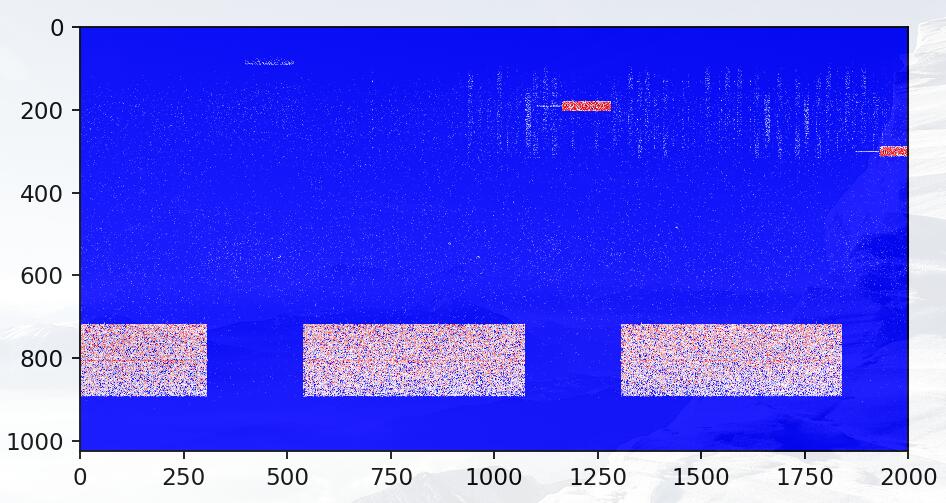
坐標(biāo)點標(biāo)出來的是實際數(shù)組中的下標(biāo),而我希望縱坐標(biāo)是頻率,橫坐標(biāo)是其他的范圍
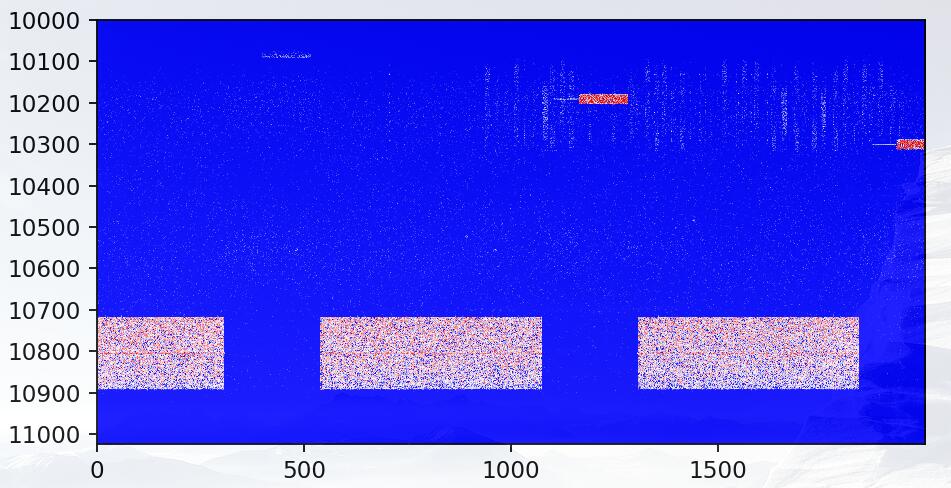
plt.yticks(np.arange(0, 1024, 100), np.arange(10000, 11024, 100))#第一個參數(shù)表示原來的坐標(biāo)范圍,100是每隔100個點標(biāo)出一次#第二個參數(shù)表示將展示的坐標(biāo)范圍替換為新的范圍,同樣每隔100個點標(biāo)出一次plt.xticks(np.arange(0, 2000, 500), np.arange(0, 50000, 500)) #同理將x軸的表示范圍由(0,2000)擴(kuò)展到(0,50000)每隔500個點標(biāo)出一次
完成!
補(bǔ)充知識:matplotlib plt.scatter()中cmap用法
我就廢話不多說了,還是直接看代碼吧!
import numpy as npimport matplotlib.pyplot as plt# Have colormaps separated into categories:# http://matplotlib.org/examples/color/colormaps_reference.htmlcmaps = [(’Perceptually Uniform Sequential’, [ ’viridis’, ’plasma’, ’inferno’, ’magma’]), (’Sequential’, [ ’Greys’, ’Purples’, ’Blues’, ’Greens’, ’Oranges’, ’Reds’, ’YlOrBr’, ’YlOrRd’, ’OrRd’, ’PuRd’, ’RdPu’, ’BuPu’, ’GnBu’, ’PuBu’, ’YlGnBu’, ’PuBuGn’, ’BuGn’, ’YlGn’]), (’Sequential (2)’, [ ’binary’, ’gist_yarg’, ’gist_gray’, ’gray’, ’bone’, ’pink’, ’spring’, ’summer’, ’autumn’, ’winter’, ’cool’, ’Wistia’, ’hot’, ’afmhot’, ’gist_heat’, ’copper’]), (’Diverging’, [ ’PiYG’, ’PRGn’, ’BrBG’, ’PuOr’, ’RdGy’, ’RdBu’, ’RdYlBu’, ’RdYlGn’, ’Spectral’, ’coolwarm’, ’bwr’, ’seismic’]), (’Qualitative’, [ ’Pastel1’, ’Pastel2’, ’Paired’, ’Accent’, ’Dark2’, ’Set1’, ’Set2’, ’Set3’, ’tab10’, ’tab20’, ’tab20b’, ’tab20c’]), (’Miscellaneous’, [ ’flag’, ’prism’, ’ocean’, ’gist_earth’, ’terrain’, ’gist_stern’, ’gnuplot’, ’gnuplot2’, ’CMRmap’, ’cubehelix’, ’brg’, ’hsv’, ’gist_rainbow’, ’rainbow’, ’jet’, ’nipy_spectral’, ’gist_ncar’])]nrows = max(len(cmap_list) for cmap_category, cmap_list in cmaps)gradient = np.linspace(0, 1, 256)gradient = np.vstack((gradient, gradient))def plot_color_gradients(cmap_category, cmap_list, nrows): fig, axes = plt.subplots(nrows=nrows) fig.subplots_adjust(top=0.95, bottom=0.01, left=0.2, right=0.99) axes[0].set_title(cmap_category + ’ colormaps’, fontsize=14) for ax, name in zip(axes, cmap_list): ax.imshow(gradient, aspect=’auto’, cmap=plt.get_cmap(name)) pos = list(ax.get_position().bounds) x_text = pos[0] - 0.01 y_text = pos[1] + pos[3]/2. fig.text(x_text, y_text, name, va=’center’, ha=’right’, fontsize=10) # Turn off *all* ticks & spines, not just the ones with colormaps. for ax in axes: ax.set_axis_off()for cmap_category, cmap_list in cmaps: plot_color_gradients(cmap_category, cmap_list, nrows)#十分類散點圖繪制randlabel = np.random.randint(0,1,10)randdata = np.reshape(np.random.rand(10*2),(10,2))cm = plt.cm.get_cmap(’RdYlBu’)z = randlabelsc = plt.scatter(randdata[:,0], randdata[:,1], c=z, vmin=0, vmax=10, s=35,edgecolors=’k’, cmap=cm)plt.colorbar(sc)plt.show()
以上這篇python matplotlib imshow熱圖坐標(biāo)替換/映射實例就是小編分享給大家的全部內(nèi)容了,希望能給大家一個參考,也希望大家多多支持好吧啦網(wǎng)。
相關(guān)文章:
1. PHP使用Swagger生成好看的API文檔2. ASP.NET MVC使用jQuery ui的progressbar實現(xiàn)進(jìn)度條3. Python3 json模塊之編碼解碼方法講解4. Python 制作查詢商品歷史價格的小工具5. Python 如何調(diào)試程序崩潰錯誤6. Python 利用Entrez庫篩選下載PubMed文獻(xiàn)摘要的示例7. ASP基礎(chǔ)知識VBScript基本元素講解8. python使用jenkins發(fā)送企業(yè)微信通知的實現(xiàn)9. Python sublime安裝及配置過程詳解10. Python 合并拼接字符串的方法

 網(wǎng)公網(wǎng)安備