python中用ggplot繪制畫圖實例講解
Python的繪圖庫也允許用戶創(chuàng)建優(yōu)雅的圖形,本章給大家介紹的是關(guān)于ggplot繪制畫圖的技巧,ggplot2建立在grid系統(tǒng)上,這個系統(tǒng)不支持紋理。需要額外創(chuàng)建一堆數(shù)據(jù),再基于這些數(shù)據(jù)構(gòu)建一個geom_path圖層,蓋在柱圖上才可以進行各種繪制,下面給大家詳細講解下怎么使用ggplot繪圖。
簡介:ggplot類是在plotnine中的,能夠生成一個圖形。
安裝:pip install pandas plotnine
csv文件加載到survs_df的數(shù)據(jù)框架:
ggplot(survs_df, aes(x=’weight’, y=’hindfoot_length’,size = ’year’)) + geom_point()生成圖形步驟:
1、設(shè)置數(shù)據(jù)框
2、需要將數(shù)據(jù)框架轉(zhuǎn)換成位置、顏色、大小等
3、顯示實際圖形元素
實例代碼:
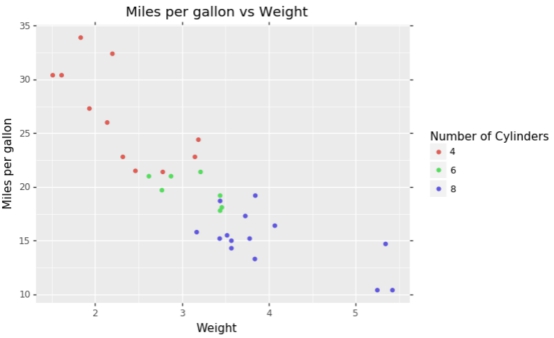
(ggplot(mtcars, aes(‘wt’, ‘mpg’, color=’factor(cyl)’))+ geom_point()+ labs(title=’Miles per gallon vs Weight’, x=’Weight’, y=’Miles per gallon’)+ guides(color=guide_legend(title=’Number of Cylinders’)) )
輸出效果:
知識點擴展:
繪制散點圖,geom_point()
讀取外部數(shù)據(jù)進行繪圖
>>> import pandas as pd>>> from ggplot import *>>> df=pd.read_table(’C:UserslenovoDesktopmtcars.txt’)>>> df··name type number volume size other0 td T 96 3 20 c1 sf F 87 5 65 c2 cc F 79 9 80 d
如果讀取的數(shù)據(jù)沒有column可以添加
df.columns=[’name’,’type’,’number’,’volume’,’size’,’other’]>>> p=ggplot(df, aes(x=’number’, y=’volume’, size=’factor(size)’, color=’factor(other)’))+geom_point()>>> print p
到此這篇關(guān)于python中用ggplot繪制畫圖實例講解的文章就介紹到這了,更多相關(guān)python中g(shù)gplot怎么繪制畫圖內(nèi)容請搜索好吧啦網(wǎng)以前的文章或繼續(xù)瀏覽下面的相關(guān)文章希望大家以后多多支持好吧啦網(wǎng)!
相關(guān)文章:
1. Python 合并拼接字符串的方法2. Linux刪除系統(tǒng)自帶版本Python過程詳解3. Python3 json模塊之編碼解碼方法講解4. Python 制作查詢商品歷史價格的小工具5. python 使用事件對象asyncio.Event來同步協(xié)程的操作6. ASP基礎(chǔ)知識VBScript基本元素講解7. ASP.NET MVC使用jQuery ui的progressbar實現(xiàn)進度條8. Python 利用Entrez庫篩選下載PubMed文獻摘要的示例9. Python sublime安裝及配置過程詳解10. Python插件機制實現(xiàn)詳解

 網(wǎng)公網(wǎng)安備